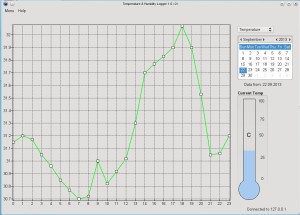
I had quite a fight with the TAChart component in Lazarus. For all who don’t know about Lazarus, it is a free Delphi alternative which runs on various platforms.
A good thing about Lazarus is, that you can play around with the components you drop at the form already within the design process. So the database can be connected and the chart component adjustesd, without compiling and running the program. But sometimes wrong settings can cause a crash of the whole IDE. For me it was the first time using the chart component. I ended up with many crashes but at one point figured it out.
My application now displays the values of 24 hours in a single graph, switchable between temperature and humidity. Also the currently measured temperature is displayed in a thermometer style graphics. I might also add a gauge for the humidity. Final part of the project is to connect it to Nagios.

Hello
Templogger looks just what I’m after. I am trying to connect an arduino to log temperature, humidity and atmospheric pressure. Is it possible to download the lazarus package? You seem to have done the hard work! Have you tried continuous logging?
Kind wishes, Hugh
Hi Hugh, sure I can make the package available. Its not perfect yet. I did some logging over ~3 months and it worked well!
Hi, great work! Is it possible to get the code for doing this?