 I am still working on my Temperature Logging project with the RaspberryPi mentioned here. The Raspberry is collecting the data and stores it in a MySQL database. Each hour, it does 5 measurements. My plan is to visualize these measurements in a little program I want to write with Lazarus. Lazarus got the TAChart component and it does exactly what I want.
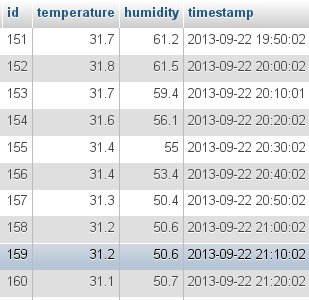
So I started to crack my head on how I want to visualize the data. Preferrably one graph per day, switchable between humidity or temperature. On the left is a part of the database table I am talking about.
My first thought was, to just extract the data hour by hour, calculate an average and display the value in the chart.
select * from log WHERE timestamp >='2013-09-21 21:00' and timestamp <='2013-09-21 22:00';
29	31.5	55.4	2013-09-21 21:00:02.000
30	31.5	55.5	2013-09-21 21:10:02.000
31	31.5	55.8	2013-09-21 21:20:02.000
32	31.4	55.9	2013-09-21 21:30:01.000
33	31.5	55.9	2013-09-21 21:40:02.000
34	31.5	56.0	2013-09-21 21:50:01.000
With this statement I would get the data hour by hour. Adding some code around and I would already get what I am looking for. But stop! Maybe the database can do all the work for me.
I started to consult the MySQL documentation and found the AVG() function. It can give me an average of my results and thats it!
select AVG(temperature) as Temperature, AVG(humidity) as Humidity from log WHERE timestamp >='2013-09-21 21:00' and timestamp <='2013-09-21 22:00';
So that’s how it looks:
Temperature             Humidity
31.483333269755047	55.750000635782875
But how about getting that output for a whole day? In that case all the work is done by the SQL server and I can just pass the result to the Chart components. Some deeper look into the MySQL documentation and I found what I was looking for. I had to group my output by the hour, but had no idea how. Here comes the DATE_FORMAT() function handy. It works with placeholders for the different parts of date, like in so many other programming languages. I am using it in my statement thrice. Once to reformat the date output to our ownly, for the GROUP BY and for the WHERE clause to select a certain day:
SELECT  DATE_FORMAT( timestamp, '%Hh' ),format(avg( temperature ),2) as Temperature,format(avg( humidity ),2) as Humidity
FROM log WHERE DATE_FORMAT( timestamp, '%d.%m.%Y' )='22.09.2013'
GROUP BY DATE_FORMAT( timestamp, '%D.%M.%Y %Hh' );
What I also found a bit annoying was the amount of decimal places. With the FORMAT() function I am reducing it to two and the output is automatically rounded:
13h	31.90	60.20
14h	31.50	57.80
15h	31.60	55.90
16h	31.70	53.35
17h	31.75	51.80
With that I am exactly where I want! That has proven again for me, that its worth to spend some effort in the way how you extract your data from a database. I would also be possible to create a view from that and with a simple select with the date, it elegantly provides only the average data…
Time to complete the Lazarus program.